DevOps focuses on continuous delivery of value by removing barriers between application development and operations teams. A crucial component of the DevOps pipeline is continuous integration (CI). CI is the process of automating a build and tests to ensure a stable code branch. Traditionally this has been difficult to achieve in web-centric and Single Page Applications (SPA) that focus on the front-end, but modern libraries and tools make it a lot easier to “chase the unicorns.”
I recently published an application to GitHub that features Angular 2, Redux, and Kendo UI. It also continuously integrates and deploys to a Docker host. You can view the running app here. It is run as a Docker container, managed by a Docker host, on an Ubuntu (Linux) server hosted in Azure.
Although the source is hosted on GitHub, I connected the repository to Visual Studio Team Services (VSTS) for continuous integration and deployment. The app has over sixty (60) automated tests that are run as part of integration. It is critical to ensure that all tests pass before the Docker image is created and deployed to production. It is also important to see the detailed results of tests so that broken builds can be quickly triaged and addressed.
Good Karma
I used the Angular Command Line Interface to scaffold the project. Out of the box, the Angular-CLI leverages Jasmine to define tests and Karma to as its test-running suite. A Jasmine test might be a simple unit test based on pure JavaScript:
Angular 2 provides a test service that enables integration-style tests that interact with actual web components:
Either way, the tests “as configured” aren’t good enough for an automated build via VSTS for two reasons:
1. They depend on a browser to host the tests (Chrome, by default) that isn’t available on the build server.
2. They only generate output to the console and don’t create a file that can be parsed for test results.
The Phantom Browser
The first step is to get rid of the browser dependency. Fortunately, a project was created to provide a “headless browser” or one that runs without rendering “real” UI, and it is called PhantomJS. To include it in my project, I issued the following command:
npm i phantomjs-prebuilt --save-dev
This creates a development dependency on the pre-built version of PhantomJS so that the project can pull it down and install it as a dependency. It adds the reference to the project’s package.json file.
The next step is to add a launcher to Karma. These packages help link Karma to browsers so Karma is able to launch the host to run the tests. The Karma launcher is installed like this:
npm i karma-phantomjs-launcher --save-dev
Finally, you need to edit the karma.conf.js configuration file to include the launcher:
Now you verify the setup by running the tests through PhantomJS:
ng test --browsers=PhantomJS
You should see the same output you normally see from Chrome, with the exception that no external browser is launched.
Note: some build machines may require you to install additional prerequisites for PhantomJS. For example, Ubuntu requires additional font libraries to be installed.
JUnit of Measure
The next requirement is to generate output that can be parsed by the build. Karma uses reporters to provide test results, and ships with a “progress” reporter that writes test results out to the command line.
By default, VSTS is able to process JavaScript unit tests in the JUnit format. Karma has a JUnit reporter that can be installed:
npm i karma-junit-reporter --save-dev
This can be added to the Karma config file the same way the PhantomJS launcher was. Now you can run tests using the --reporters=junit flag and the test run will generate a file named TESTS-browser_(platform).xml. For example, a local run on Windows 10 creates TESTS-Chrome_54.0.2840_(Windows_10_0.0.0).xml. If you open the file, you’ll see XML that defines the various test cases, how long they ran, and even a structure that holds the console output.
Configuring VSTS
I assume you know how to configure builds in VSTS. If not, check out the full CI/CD article. The build steps I created look like this:
The first step ensures the Angular Command Line interface is installed on the environment. The package manager command is install and the arguments are:
(This is the version the project was built with). The second step installs the dependencies for the project itself and just uses the install command with no arguments.
With the Angular-CLI installed, we can now run a command to execute the tests and generate the output file. I use two reporters. The progress reporter allows me to see the progress of the test run in the console output for the build and will abort the build if any tests fail. The JUnit reporter writes the test results file. The tool is ng and the arguments:
test --watch=false --single-run=true --reporters=junit,progress --browsers=PhantomJS
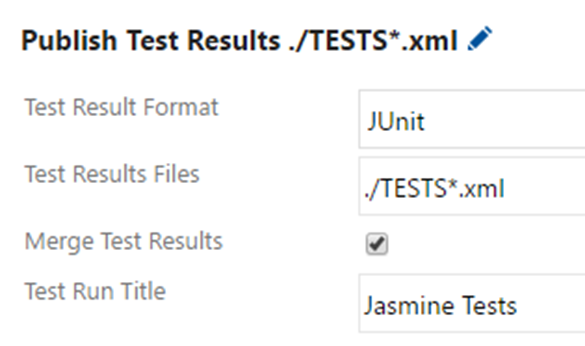
The next step instructs the VSTS agent to read the test results file and integrate it into the build results. This is what the configuration looks like:
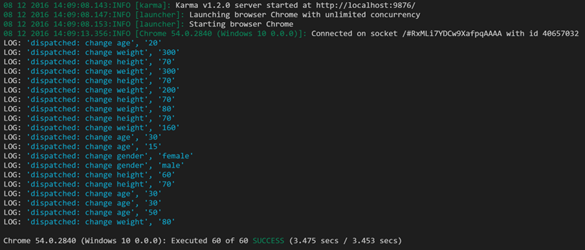
Here is a snippet of the test run output:
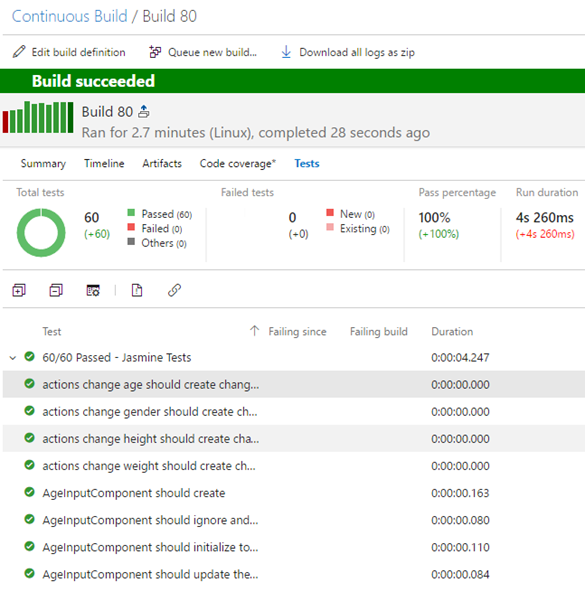
That’s it! Now the automated build can create the Angular 2 production application after verifying tests successfully ran. The VSTS build log will contain specific test results and even allow you to set up a widget to chart pass/fail percentage over time. Release Management can then take the results of a successful build and deploy to production. For a more comprehensive overview of the CI/CD process, please read DevOps: Continuous Deployment with Visual Studio Team Services and Docker.
Happy DevOps!


